Cold Email Open Rate Benchmarks 2026: What Still Matters and What Doesn't
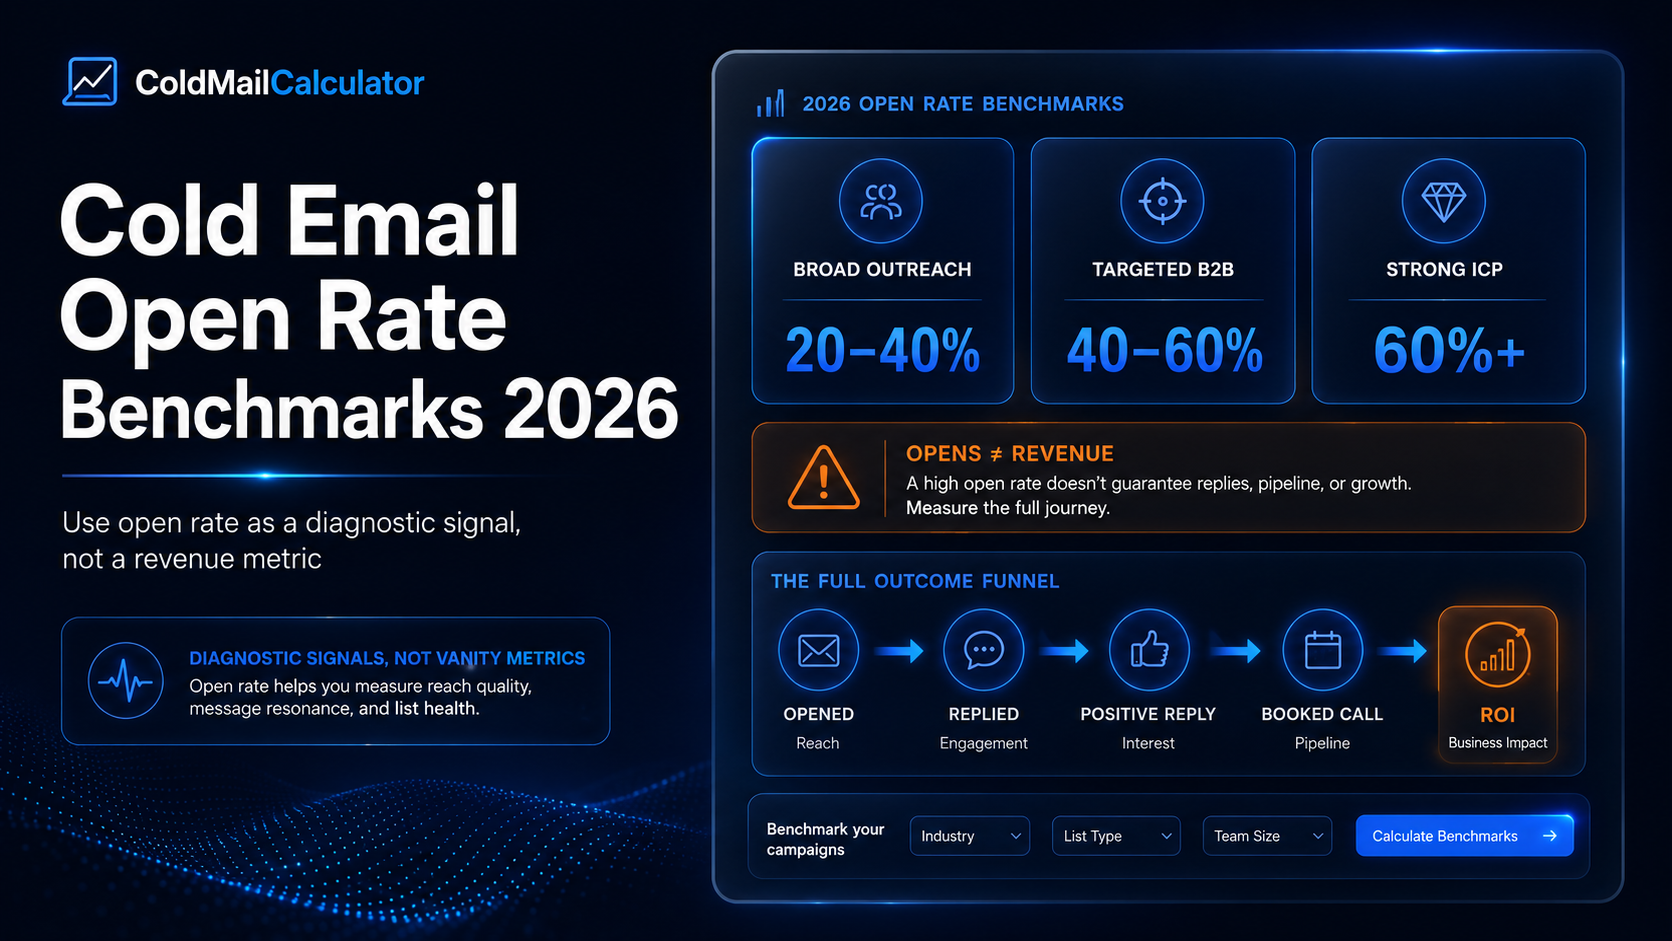
A good cold email open rate in 2026 is 40-60% for most B2B campaigns. But open rate is an increasingly unreliable metric. Apple Mail Privacy Protection inflates counts. Microsoft pre-fetches images. Many opens are bots. The real question isn't whether your emails are opened but whether they produce replies, meetings, and revenue.
Short answer
- Average B2B open rate: 40-60% in 2026
- Apple MPP inflates opens by 15-25% on average
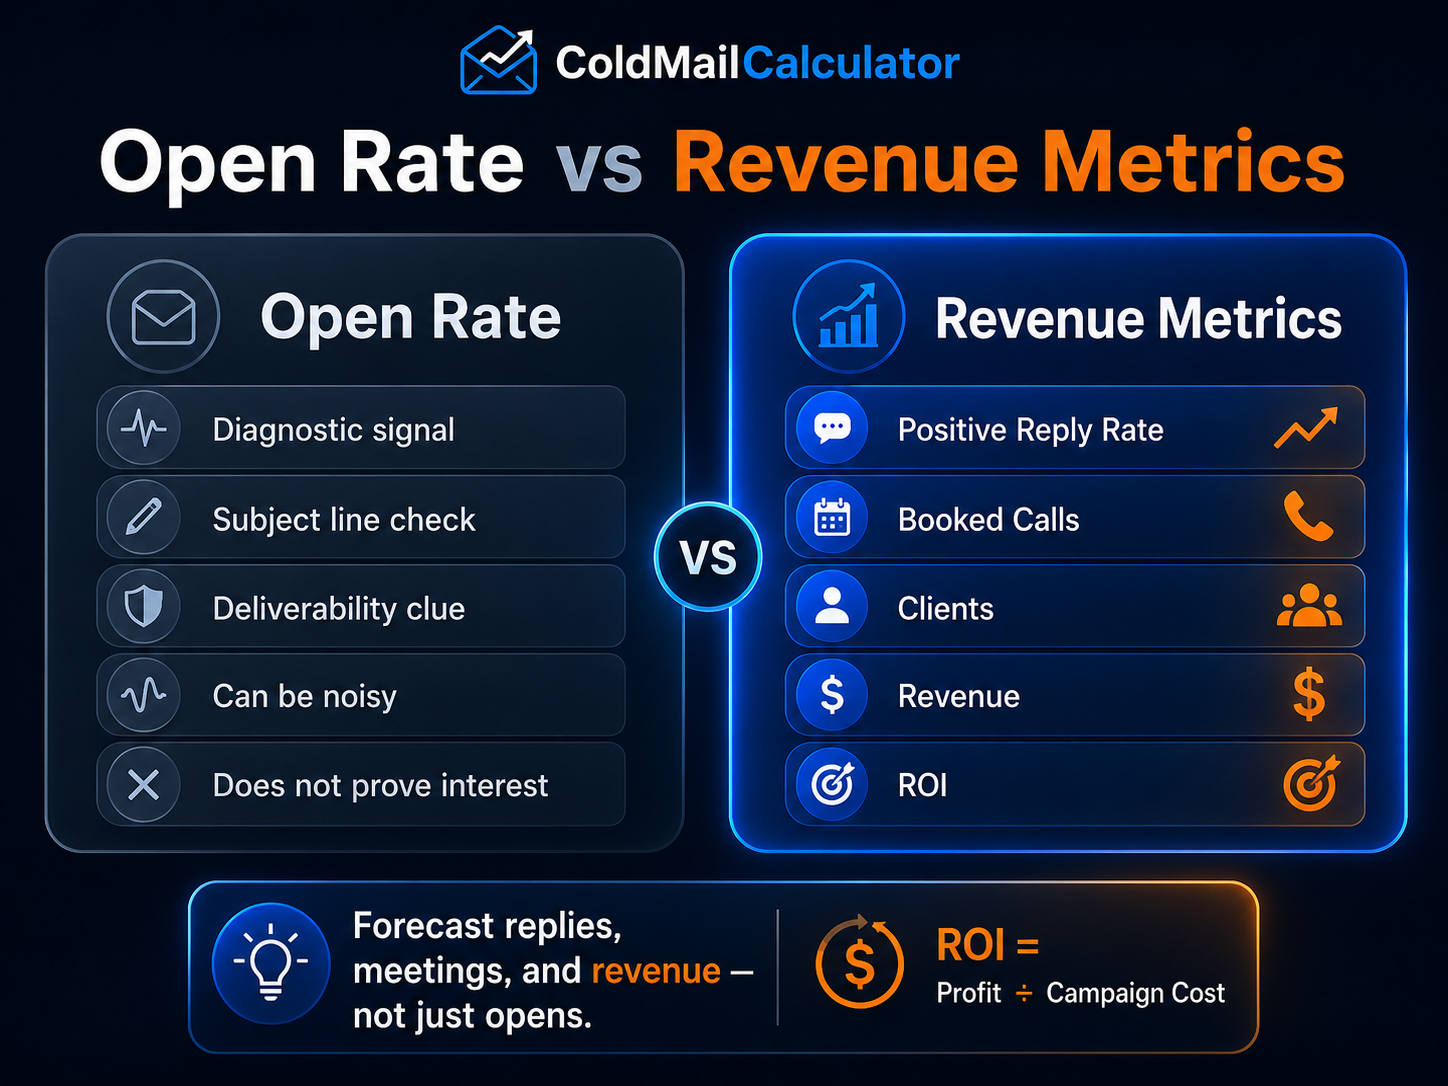
- Open rate does not correlate with replies, meetings, or revenue
- Track reply rate and conversion instead of open rate
Why Open Rate Became a Vanity Metric
Open rate was once the gold standard for cold email performance. If people opened, your subject line worked. If they did not, you needed a better hook. That changed when Apple introduced Mail Privacy Protection (MPP) in 2021 and Microsoft Outlook began pre-fetching images at the server level.
Today, a significant portion of measured opens are not human. Apple MPP automatically opens every email in the background for users who have enabled the feature. Outlook pre-fetches images before the recipient scrolls. Third-party email security scanners trigger pixel loads. The result is open rate data that is noisy, inflated, and misleading.
As of 2026, industry estimates suggest that 25-35% of all tracked opens are non-human. If your ESP reports a 55% open rate, your true human open rate could be as low as 35-40%.
Cold Email Open Rate Benchmarks by Industry
These ranges assume authenticated domains (SPF, DKIM, DMARC), clean lists, and non-spam subject lines. Numbers on the lower end typically reflect broad targeting. Numbers on the higher end reflect narrow ICPs and strong subject line testing.
Open Rate by Industry (2026)
| Industry | Average open rate | Notes |
|---|---|---|
| SaaS | 45-55% | Higher for product-led outreach, lower for enterprise |
| Agencies | 50-65% | Personalized agency outreach tends to open well |
| E-commerce | 35-45% | High volume, lower relevance per contact |
| Finance | 40-50% | Compliance restrictions reduce subject line creativity |
| Healthcare | 35-50% | HIPAA concerns and strict IT filters |
| Real Estate | 40-55% | Localized outreach performs best |
| Education | 45-60% | Academic email protocols are generally permissive |
Industry is less predictive than list quality and sender reputation. A well-maintained list with a strong sender reputation will outperform the industry averages regardless of sector.
What Apple Mail Privacy Protection Actually Does
Apple MPP, introduced in iOS 15 and still active in 2026, works by pre-loading all email content in the background when a message arrives. This means Apple Mail opens and renders every email including images and tracking pixels regardless of whether the user ever looks at it.
For cold email senders, the impact is significant:
- Inflated open rates: Campaigns with heavy Apple Mail readership can see open rates inflated by 15-25 percentage points
- Broken A/B testing: Subject line tests become unreliable when open data is contaminated
- False positives: A high open rate can mask poor engagement if most opens are MPP-generated
Microsoft Outlook also pre-fetches images for some account types, adding another layer of noise. The only way to measure human engagement reliably is to track downstream actions like replies and clicks.
What to Track Instead of Open Rate
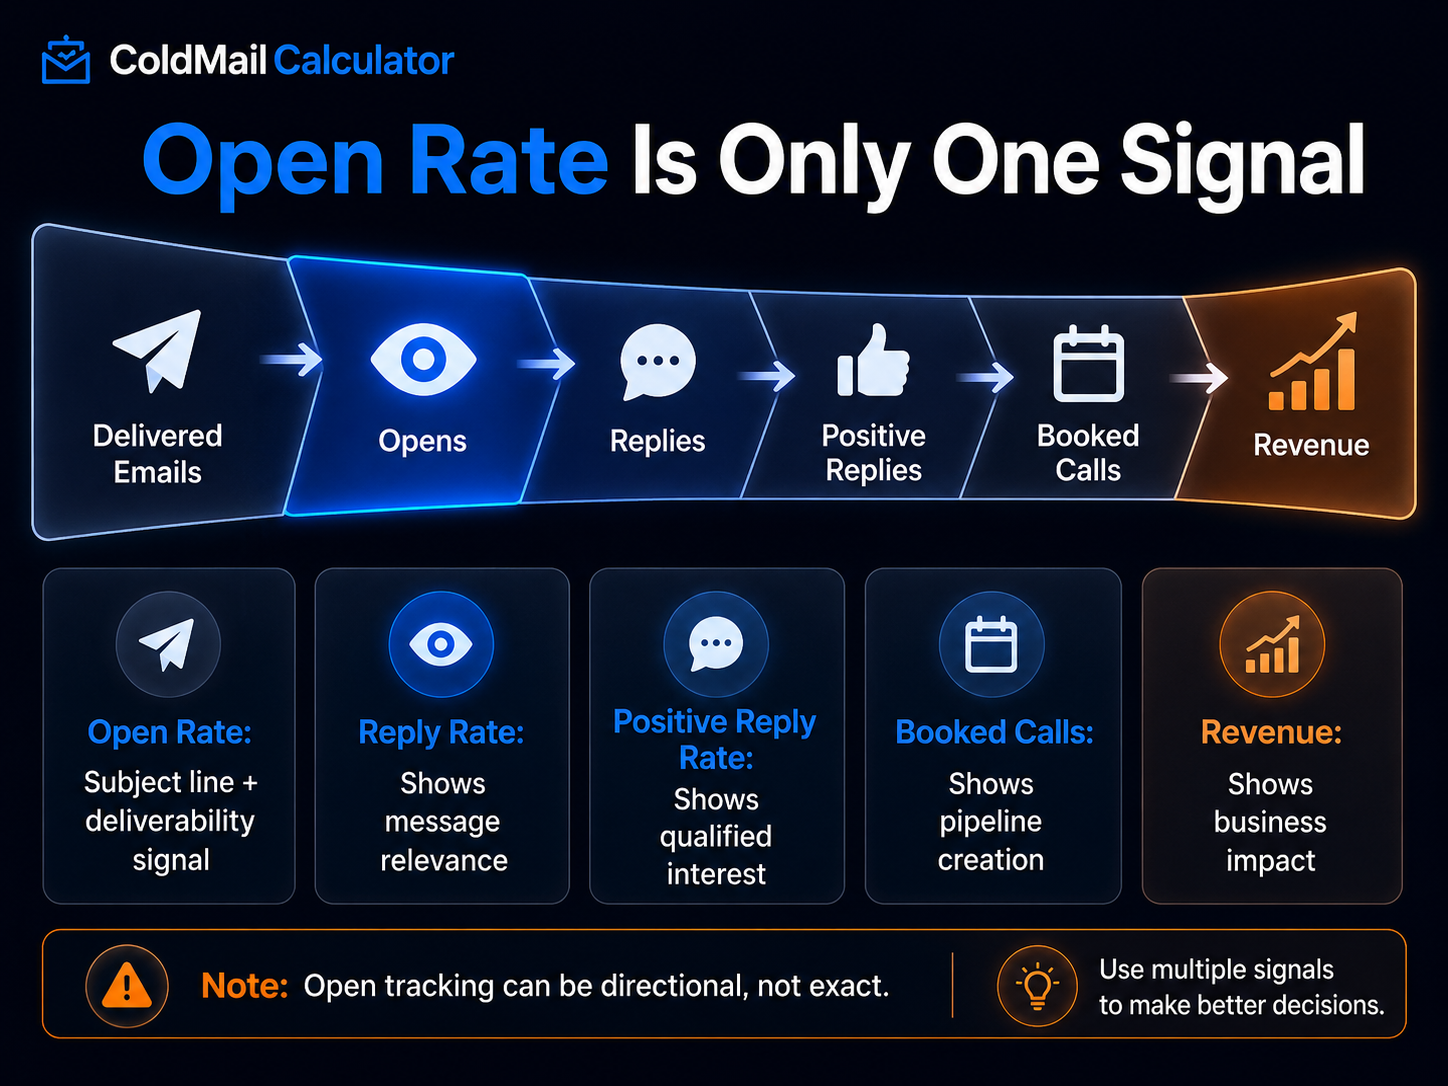
If open rate is unreliable, what should you track? The answer depends on your goal, but these metrics all correlate better with pipeline and revenue:
- Positive reply rate: The percentage of delivered emails that receive a genuine interested response. This is the closest leading indicator of meetings and revenue. Read more on positive reply rate in cold email.
- Reply rate (total): Still useful for deliverability diagnostics, even if it includes noise. A sudden drop in total reply rate may indicate a deliverability problem.
- Meeting booking rate: The percentage of delivered emails that result in a booked meeting. This is the closest lagging indicator to revenue.
- Click-through rate: If you include links, clicks are harder to fake than opens. A click is an intentional human action.
- Conversion to pipeline: The ultimate metric. How many emails eventually produce a qualified opportunity?
Use the ColdMailCalculator to model how changes in positive reply rate and meeting booking rate affect your total campaign ROI, instead of guessing based on inflated open rates.
How Open Rate Still Has Limited Value
Open rate is not entirely useless. It still provides directional signal in specific contexts:
- Subject line testing (with caveats): If you control for Apple MPP by segmenting non-Apple users, subject line A/B tests can still provide signal. But the sample size needed has increased.
- Deliverability flag: A sudden drop from 50% to 10% open rate likely indicates a deliverability problem. The absolute number is unreliable but large swings are diagnostic.
- Trend analysis: Within a consistent audience over time, open rate trends can indicate whether engagement directionally improves or declines.
But none of these use cases justify optimizing your campaigns around open rate. The senders who win in 2026 optimize for replies and meetings, not opens.
Stop guessing open rates and start forecasting revenue
Use the ColdMailCalculator to model how reply rate improvements translate into real pipeline numbers.
Use the Cold Email ROI CalculatorHow the ColdMailCalculator Handles Open Rate
The ColdMailCalculator does not use open rate in its forecasting model. Instead, it relies on positive reply rate and meeting booking rate the metrics that actually drive revenue. This means your forecast is not contaminated by inflated or unreliable open rate data.
If you enter metrics that include open rate assumptions, the calculator helps you translate those into reply-based projections. For example, if you know your historical open-to-reply conversion ratio, you can use it to estimate reply rates from open rate data. But the core forecast always runs on replies and meetings.
Final Takeaway
Open rate was a useful metric in 2018. In 2026, it is a vanity metric propped up by Apple MPP, Outlook prefetch, and scanner bots. The senders who still optimize for open rate are optimizing for the wrong thing.
Shift your focus to positive reply rate and meeting booking rate. Those metrics correlate with pipeline. Open rate correlates with nothing except whether your recipients use Apple Mail.
Run your numbers through the ColdMailCalculator to see what actually matters for your campaign performance.
FAQ
What is a good open rate for cold email in 2026?
A good cold email open rate in 2026 is 40-60% for most B2B campaigns. Rates above 60% are exceptional. Rates below 30% suggest deliverability or subject line issues. However, open rate is an unreliable metric due to Apple Mail Privacy Protection and other image-blocking privacy features.
Why is open rate considered a vanity metric in cold email?
Open rate is unreliable because Apple Mail Privacy Protection (MPP) auto-opens every email for privacy, inflating open counts. Microsoft Outlook also pre-fetches images. Many so-called opens are bots, not humans. Open rate also tells you nothing about whether the recipient was interested, only that a pixel loaded.
What should I track instead of open rate?
Track positive reply rate, meeting booking rate, and conversion to pipeline instead of open rate. These metrics correlate with revenue. Open rate correlates with nothing except subject line curiosity and whether Apple users have MPP enabled.
What is the average cold email open rate by industry?
SaaS: 45-55%, Agencies: 50-65%, E-commerce: 35-45%, Finance: 40-50%, Healthcare: 35-50%, Real Estate: 40-55%, Education: 45-60%. These ranges assume clean lists, authenticated domains, and non-spam subject lines. Industry alone is less predictive than list quality and sender reputation.
How does Apple Mail Privacy Protection affect open rate tracking?
Apple MPP, introduced in 2021 and still affecting 2026 data, pre-fetches and opens all emails on Apple Mail clients before the recipient ever sees them. This inflates open rates by 15-25% on average. For any campaign with significant Apple Mail recipients, open rate is largely meaningless.
Get a free cold email funnel audit
Not sure which metrics you should be tracking? Get a free cold email funnel audit and shift from vanity metrics to revenue-focused reporting.
Request API Access