Cold Email Benchmarks for SaaS: Reply Rate, Meetings, and Payback
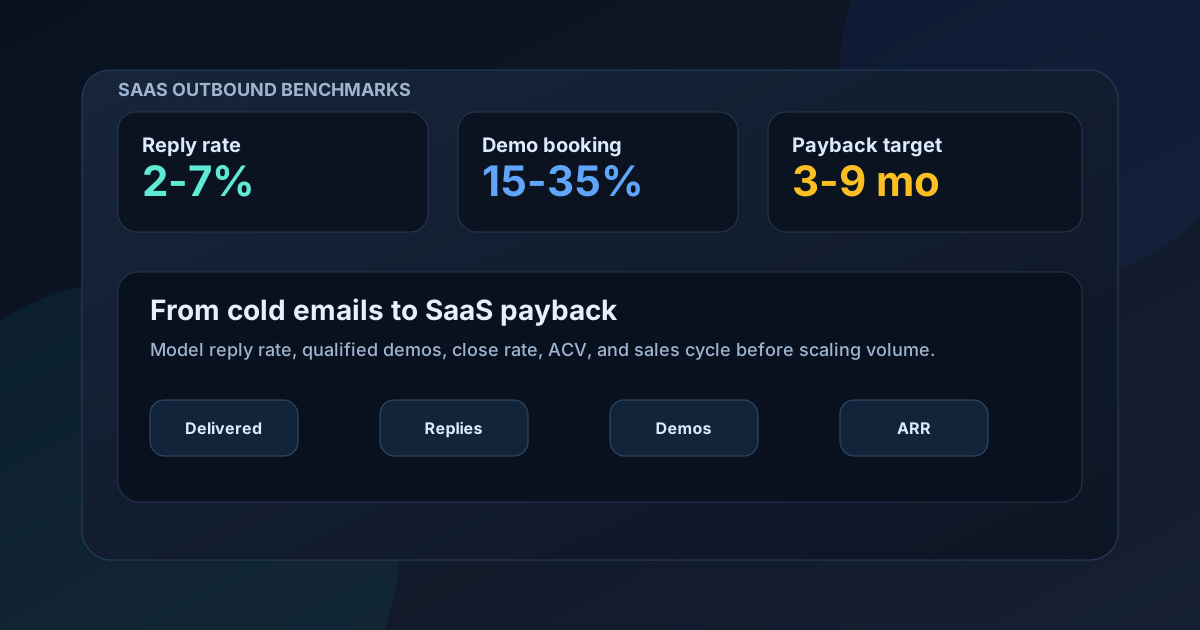
For SaaS cold email planning, many teams model reply rates around 1-3% for broad outreach, 2-7% for targeted ICP campaigns, and 7-12%+ for narrow account-based campaigns with strong relevance. But reply rate is only the top of the model. SaaS teams should connect replies to qualified demos, close rate, ACV, sales cycle, CAC, and payback before increasing send volume.
Short answer
Useful SaaS cold email benchmarks are planning ranges, not promises. Start conservative, then replace assumptions with your own delivered-email data.
- Broad SaaS outbound: often modeled around 1-3% reply rate.
- Targeted SaaS ICP campaign: often modeled around 2-7% reply rate.
- Highly relevant account-based SaaS outreach: often modeled around 7-12%+ reply rate.
- Qualified demo and payback matter more than total replies.
Actual results depend on ICP fit, list quality, offer, deliverability, ACV, sales cycle, and how quickly the sales team follows up.
Why SaaS Benchmarks Are Different
SaaS cold email is not judged the same way as local service, agency, recruiting, or ecommerce outreach. A SaaS campaign often has a longer evaluation path: reply, qualification, demo, trial or proof, opportunity, procurement, close, onboarding, retention, and expansion.
That means a high reply rate can still be weak if the replies are from poor-fit accounts, students, vendors, tiny companies, or people outside the buying committee. A lower reply rate can be strong if it produces qualified demos with the right role, company size, problem, and budget.
Use benchmarks to set a base case, then forecast the full SaaS revenue path. If the math does not work at realistic reply and close rates, fix the segment, offer, list, or pricing before scaling.
SaaS Cold Email Benchmark Ranges
The table below gives practical planning assumptions for SaaS outbound. Use the low end for new domains, unproven segments, weak data, or early testing. Use the higher end only when the campaign has tight targeting, strong relevance, and proven follow-up.
| Campaign type | Reply rate planning range | Best use case | What to watch |
|---|---|---|---|
| Broad SaaS outbound | 1-3% | Market testing, early category education, low personalization | Low qualification, weak demo conversion, deliverability risk |
| Targeted ICP campaign | 2-7% | Specific vertical, company size, role, and pain point | Positive reply quality and booked demo rate |
| Account-based campaign | 7-12%+ | Narrow account list with strong trigger, research, and relevance | Labor cost and slower scale |
| Expansion or warm-ish outbound | Often higher | Existing users, partner lists, event lists, or known accounts | Do not compare directly with pure cold email |
| Weak fit campaign | Below 1-2% | Unclear ICP, generic offer, poor list, or bad timing | More volume usually increases CAC |
Benchmarks Beyond Reply Rate
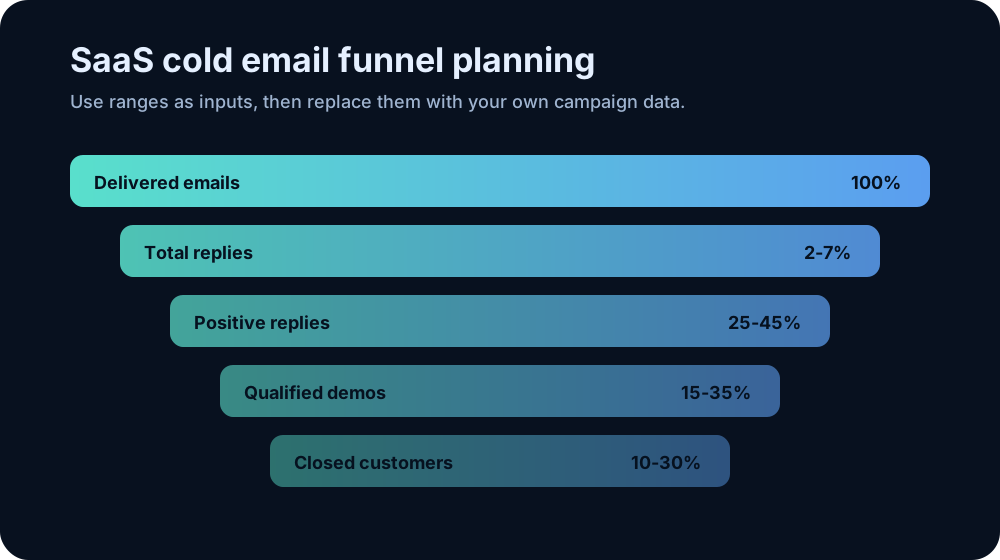
For SaaS, reply rate is a diagnostic metric. Revenue planning needs the steps after the reply. Track total replies, positive replies, qualified demos, opportunities, customers, ACV, gross margin, sales cycle, and payback together.
| Metric | Planning input | Why it matters | Common mistake |
|---|---|---|---|
| Delivery rate | 80-95% | Creates the real denominator for reply math | Modeling from sent emails while ignoring bounces |
| Total reply rate | 1-7% for most tests | Shows whether the message earns attention | Treating every reply as pipeline |
| Positive reply share | 25-45% of replies | Separates interest from objections or noise | Inflating forecast with negative replies |
| Demo booking rate | 15-35% of positive replies | Shows whether interest becomes a sales conversation | Assuming every positive reply books |
| Demo close rate | 10-30% | Turns demos into customers | Using blended inbound close rates for cold outbound |
| CAC payback | 3-12 months | Shows whether outbound cash recovery is realistic | Ignoring gross margin and sales cycle |
ACV Changes the Benchmark
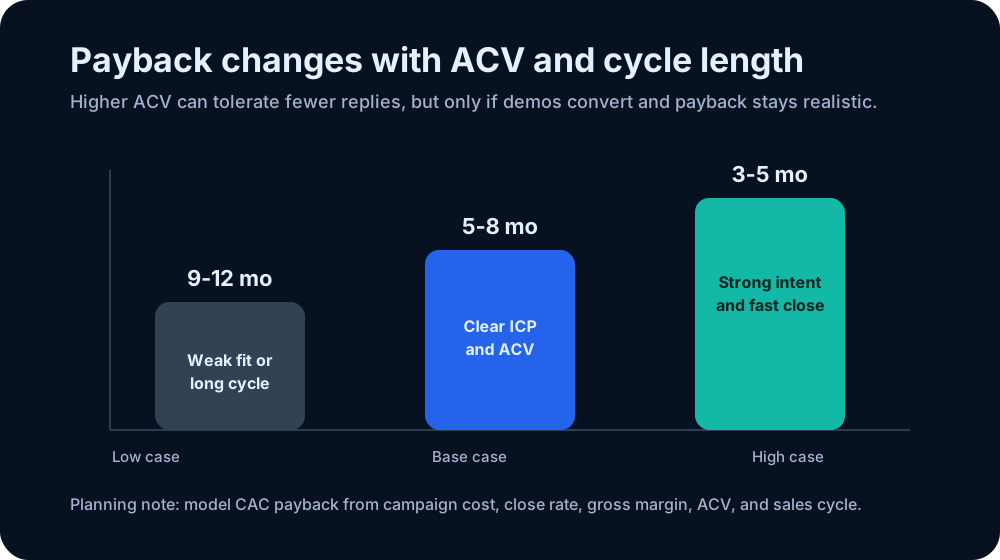
Average contract value changes what a "good" campaign looks like. A low-ACV SaaS product needs more efficient conversion because each customer contributes less revenue. A high-ACV SaaS product can tolerate fewer meetings, but only if those meetings are qualified and the sales cycle does not stretch payback too far.
For example, a $1,200 annual plan may need a repeatable self-serve or product-led motion after the first reply. A $24,000 annual plan can justify more research and lower volume if one customer covers the campaign cost. A $100,000 enterprise plan may care less about reply rate and more about target-account quality, stakeholder mapping, and opportunity creation.
| SaaS ACV | Outbound implication | Benchmark focus | Risk |
|---|---|---|---|
| Low ACV | Needs high efficiency and low labor per prospect | Cost per qualified trial or demo | Manual personalization can erase margin |
| Mid-market ACV | Can support targeted lists and sales-assisted demos | Qualified demo rate and close rate | Too-broad ICP creates expensive meetings |
| Enterprise ACV | Can support account research and multi-threading | Opportunity quality and pipeline value | Long sales cycle delays payback |
How to Forecast SaaS Cold Email Payback
Start with campaign cost, not just volume. Include lead data, enrichment, verification, domains, inboxes, sending tools, copy, labor, sales time, and any agency or contractor spend. Then connect that cost to gross profit from customers won through the campaign.
SaaS outbound payback formula
If the campaign costs $4,000 and produces customers that contribute $1,000 in monthly gross profit, payback is roughly four months. If the same campaign produces $250 in monthly gross profit, payback stretches to sixteen months before sales labor and churn are considered.
Use conservative assumptions for new segments. If the base case only works with an aggressive close rate, the campaign may be too fragile.
Model SaaS outbound before sending
Change reply rate, demo booking rate, close rate, customer value, and campaign cost to see whether the campaign can pay back.
Use the ColdMailCalculatorBenchmarks by SaaS Motion
The right benchmark also depends on the sales motion. Product-led, sales-led, and enterprise SaaS campaigns should not use the same success definition.
| SaaS motion | Primary cold email goal | Metric to optimize | Useful internal link |
|---|---|---|---|
| Product-led SaaS | Qualified trials, audits, or activation calls | Positive reply to activation | Industry response benchmarks |
| Sales-led SaaS | Qualified demos with buying context | Demo booking and close rate | Forecast cold email ROI |
| Enterprise SaaS | Target-account conversations | Opportunity quality and pipeline value | ColdMailCalculator |
What to Fix When SaaS Benchmarks Are Low
If reply rate is low, check list quality, ICP fit, deliverability, subject line clarity, first-line relevance, and offer specificity. If replies are decent but demos are weak, the CTA, qualification question, or sales handoff may be the bottleneck. If demos book but close poorly, the issue may be targeting, positioning, pricing, or product fit.
- Split founder, sales leader, RevOps, marketing, and technical buyer lists.
- Segment by company size, funding, hiring signals, tech stack, and current workflow.
- Use one clear pain point instead of a generic "grow revenue" pitch.
- Track positive reply rate separately from total replies.
- Measure qualified demos, not just calendar bookings.
- Compare payback windows by ACV and gross margin.
- Use low, base, and high scenarios before increasing volume.
Build forecasting into your SaaS dashboard
Use the ColdMail API to estimate replies, meetings, customers, revenue, profit, ROI, and risk from campaign assumptions.
Get Free API KeyFinal Takeaway
Cold email benchmarks for SaaS are useful only when they connect to revenue economics. Do not stop at reply rate. Model delivered emails, positive replies, qualified demos, close rate, ACV, gross margin, sales cycle, campaign cost, and payback.
Start with conservative benchmark ranges, run a narrow test, then update your forecast with real campaign data. The best SaaS outbound teams use benchmarks as a planning tool, not a promise.
FAQ
What is a good cold email reply rate for SaaS?
For planning, broad SaaS outreach is often modeled around 1-3%, targeted ICP campaigns around 2-7%, and narrow account-based campaigns around 7-12%+. Actual results vary.
What is a good demo booking rate from cold email replies?
Many teams model 15-35% of positive replies becoming qualified demos, depending on offer clarity, buyer fit, follow-up speed, and sales process.
Should SaaS teams optimize for reply rate or demos?
Optimize for qualified demos, opportunities, customers, and payback. Reply rate helps diagnose attention, but it does not prove revenue quality.
How does ACV affect SaaS cold email benchmarks?
Higher ACV can support lower volume and more manual research, while lower ACV usually needs more efficient conversion and lower labor cost per prospect.
How do I calculate SaaS outbound payback?
Divide campaign cost by monthly gross profit from new customers. Include gross margin and sales cycle when comparing scenarios.