Planning guide
Cold Email Metrics Explained: What Each Number Means
Open, click, reply, positive reply, meeting, close — each cold email metric answers a different question. Here is what each number means and how they connect.
Last updated July 9, 2026 · ColdMailCalculator, operated by Wade Digital
The short answer
Cold email metrics are stage rates in one funnel: sent → delivered → opened → clicked → replied → positive reply → meeting → client. Each rate answers a different question, and because they multiply, a small drop at the top is amplified at the bottom.
The metrics that predict revenue are positive reply rate, meeting rate, and close rate. Open and click rates are diagnostics that explain leaks, not outcomes on their own.
Top-of-funnel diagnostics
Delivery rate tells you whether mail is accepted. Open rate tells you whether the subject and sender earned a look — but it is inflated by email clients that auto-preload content, so read it as directional. Click rate tells you whether the offer earned exploration.
These three are useful for diagnosing problems early: a sudden open-rate drop usually means a deliverability issue, not a copy problem.
The intent metrics
Reply rate shows the message prompted a response. Positive reply rate — genuine interest only — is the pipeline signal, because only positive replies become meetings. Separate the two: a high total reply rate full of 'not interested' replies is not progress.
The revenue metrics
Meeting rate is positive replies that become booked calls. Attended rate is those that actually happen — a leak here is a scheduling problem, not outreach. Close rate is meetings that become clients. Cost per meeting and CAC translate the funnel into economics, and ROI tells you whether it paid.
How the metrics connect
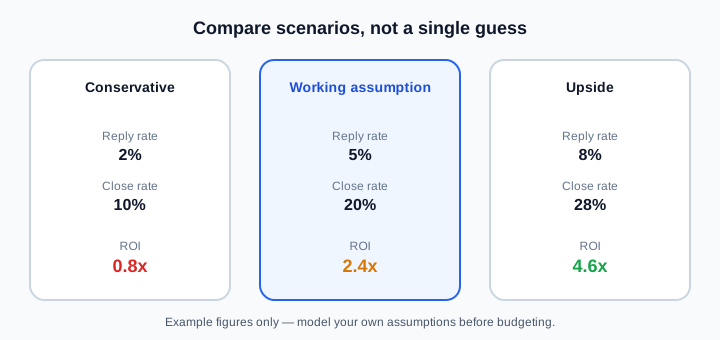
Overall conversion from sent to client is the product of every stage rate. At 5% reply, 40% positive, 50% meeting, and 20% close, you get about 0.2% — roughly one client per 500 emails. Move any single rate and the outcome swings hard, which is why you model scenarios instead of trusting one flat number.
A dashboard that shows only opens and replies hides risk. You need the full chain so a leak at 'attended' or 'close' is visible.
Reading cold email metrics
- Map every metric to its funnel stage.
- Separate total reply rate from positive reply rate.
- Treat open and click as diagnostics, not outcomes.
- Track meeting, attended, and close rates per campaign.
- Connect the funnel to cost per meeting and ROI.
Common mistakes
- Headlining opens while ignoring positive replies.
- Treating total replies as if all were interest.
- Forgetting to show absolute counts next to rates.
- Ignoring the attended and close stages entirely.
Frequently asked questions
What does each cold email metric mean?
Each is a stage rate in the funnel from sent to client — delivery, open, click, reply, positive reply, meeting, attended, and close — plus cost and ROI. Together they show where the funnel leaks.
Which cold email metrics are vanity?
Open rate and raw send volume are the weakest signals: opens are inflated by auto-preload and sends are an input, not a result. Reply rate and positive reply rate predict pipeline far better.
How do cold email metrics connect?
They multiply down the funnel; overall conversion is reply rate × positive reply rate × meeting rate × close rate. A drop at any stage is amplified by the stages below it.
Related pages
Related guides
Put this into your own numbers
This article is educational planning content, not guaranteed results, legal advice, or compliance advice. Use the calculator to model your own assumptions.
Estimates are based on user-provided assumptions and are not guaranteed. See the disclaimer for details.