Planning guide
The Email Outreach KPIs You Should Review Monthly
A monthly KPI review keeps outreach honest. Here are the email outreach KPIs to track and the cadence that catches problems before they scale.
Last updated July 9, 2026 · ColdMailCalculator, operated by Wade Digital
The short answer
Review delivery, open, click, reply, positive reply, meeting, close, cost per meeting, CAC, ROI, and complaint rate on a monthly cadence — weekly for engagement and deliverability, monthly for economics. The KPIs that predict revenue are positive reply rate, meeting rate, and cost per meeting.
The point of the review is to catch a leaking stage early, not to celebrate sends. Pair every rate with its absolute count.
The KPIs that predict revenue
Positive reply rate shows whether messaging earns interest. Meeting rate shows whether interest becomes a conversation. Cost per meeting and CAC show whether the campaign pays. Close rate shows whether conversations become revenue.
Open and click rates belong in the review as diagnostics — they explain leaks but are not outcomes. A dashboard headlined on opens hides losing campaigns.
A simple monthly review cadence
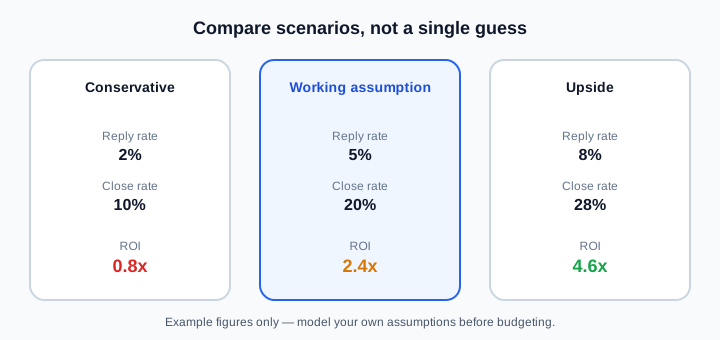
Weekly: delivery, open, click, reply, positive reply, and complaint trends. Monthly: cost per meeting, CAC, ROI, and close rate versus your working assumptions. Per campaign: actuals against conservative, working, and upside forecasts. Quarterly: replace benchmark ranges with your own verified rates.
Assign one owner to the review so it actually happens. A KPI with no owner is not reported.
Charts that make the review useful
A funnel chart (sent → delivered → opened → replied → meeting → client) with counts and rates. A trend line of reply and positive reply rate per wave. A cohort table by list segment or offer. A cost chart of cost per meeting and CAC versus target.
Show counts next to rates so a small sample is not mistaken for strong performance — a 50% meeting rate from two replies is not the same as 50% from 200.
Turn the review into action
End each review with one change and one validation test: tighten targeting, adjust the offer, or fix deliverability. Measure that single variable on the next wave so the review compounds instead of producing another deck.
Monthly outreach KPI review
- Review engagement and deliverability weekly.
- Review cost per meeting, CAC, ROI, and close rate monthly.
- Compare actuals to forecast per campaign.
- Headline positive reply rate and cost per meeting, not opens.
- Assign one owner and end with one testable change.
Common mistakes
- Headlining sent volume and opens instead of economics.
- Reviewing rates with no absolute counts shown.
- No named owner for the review.
- Reporting without a resulting action or test.
Frequently asked questions
Which KPIs predict revenue?
Positive reply rate, meeting rate, and cost per meeting predict pipeline and economics most directly. Open and click rates are diagnostics that explain leaks, not outcomes.
How often should I review outreach KPIs?
Weekly for engagement and deliverability, monthly for cost per meeting, CAC, ROI, and close rate, and per campaign against forecast. Replace benchmarks with your own data quarterly.
What is a good monthly trend?
Stable or improving positive reply rate and meeting rate, cost per meeting trending down, complaint rate near zero, and actuals tracking close to your working forecast.
Related pages
Related guides
Put this into your own numbers
This article is educational planning content, not guaranteed results, legal advice, or compliance advice. Use the calculator to model your own assumptions.
Estimates are based on user-provided assumptions and are not guaranteed. See the disclaimer for details.