Planning guide
How to Use a Cold Email Performance Calculator
A performance calculator turns assumptions into a forecast. Here is what it outputs, how to read the results, and which inputs matter most.
Last updated July 9, 2026 · ColdMailCalculator, operated by Wade Digital
The short answer
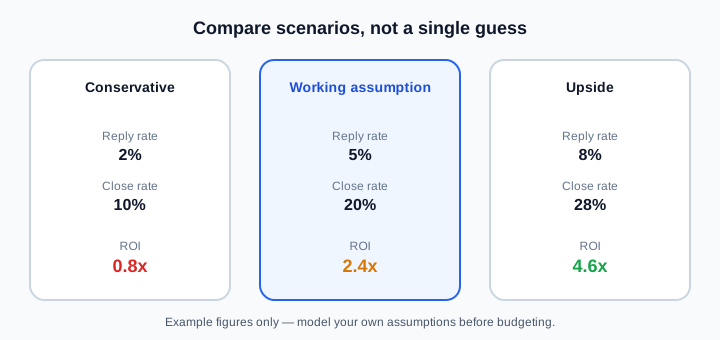
A cold email performance calculator takes your funnel assumptions and costs, then outputs estimated replies, meetings, clients, total cost, net profit, ROI, CAC, and cost per meeting. The point is not a single prediction — it is comparing a conservative, working, and upside scenario before you spend.
Read the output as a range with assumptions attached, not a promise. The value is exposing which assumption moves the outcome most.
What it outputs
Funnel outputs: estimated replies, positive replies, meetings, attended meetings, and clients from your stage rates. Economics: revenue, total cost, net profit, ROI multiple, CAC, and cost per meeting. Risk: a score and the weakest stage identified.
Seeing profit and CAC next to replies is what stops a campaign that 'looks busy' from hiding a losing unit economics.
The inputs that matter most
Positive reply rate and meeting rate dominate the outcome because they sit closest to revenue. Close rate and deal value set how much each client is worth. Cost inputs — mailboxes, domains, data, tools, labor — set whether the campaign pays back.
Volume sets the top of the funnel, but piling volume onto a weak stage just scales the loss. Fix the stage rates first, then scale.
How to read the scenarios
Build three scenarios: conservative (your worst realistic rates), working (your expected rates), and upside (your best case). If even the working scenario fails to cover cost, the campaign economics are wrong before a single email is sent.
The gap between conservative and upside is usually the difference between a campaign that loses money and one that pays back within a month — which is exactly why modeling three side by side beats one optimistic number.
What to do after the calculation
Document the weakest funnel stage and design one small validation test for it — tighter targeting, a clearer offer, or a deliverability fix. Then measure that single variable on the next wave and revisit the forecast with real data.
Before you trust the output
- Enter conservative, working, and upside scenarios — not one number.
- Include every cost: mailboxes, domains, data, tools, labor.
- Use your own verified rates where you have them.
- Identify the weakest stage from the output.
- Design one validation test, then re-forecast with real data.
Common mistakes
- Entering only an optimistic scenario.
- Omitting labor or infrastructure cost from the model.
- Treating the output as a guarantee rather than a range.
- Scaling volume before fixing a weak stage rate.
Frequently asked questions
What does a cold email performance calculator output?
Estimated funnel outcomes (replies, meetings, clients), economics (revenue, cost, profit, ROI, CAC, cost per meeting), and a risk score with the weakest stage identified.
How do I read the results?
Compare conservative, working, and upside scenarios. If even the working scenario fails to cover cost, the economics are wrong before sending. Use the gap to see how much a stage-rate change is worth.
Which inputs matter most?
Positive reply rate, meeting rate, close rate, and deal value drive outcomes; mailbox, domain, data, tool, and labor costs decide whether the campaign pays back.
Related pages
Related guides
Put this into your own numbers
This article is educational planning content, not guaranteed results, legal advice, or compliance advice. Use the calculator to model your own assumptions.
Estimates are based on user-provided assumptions and are not guaranteed. See the disclaimer for details.